
by Mike Pavlichko
I’ll preface this piece by saying my peace: I have no idea if this is right or wrong, in whole or in part.
That may not give you much confidence, but in my exercise of recalculating the entire season of Strength index numbers after finding a technical glitch in my automated worksheets earlier this month, I came up with different numbers for virtually every team in the state.
And I still have nothing to compare it to.
Gridiron New Jersey is the official calculator of all things relating to the playoffs, of which there were none in 2020 due to the COVID-19 pandemic. They figure out power points, Strength Index, OSI and UPR.
But after one full year of the system, following the Born Power Index debacle, the numbers were not tracked publicly this year since there were no playoffs.
Challenge accepted.
We promise never to be behind a paywall. If you enjoy Central Jersey Sports Radio’s coverage, please consider click below to make a donation so we can continue to highlight the outstanding efforts of the many talented student-athletes in Central Jersey.
All I can tell you is that at least some of the numbers that I ran through the first time around (read the article here) were not correct, most notably Somerville.
Central Jersey Sports Radio has been told by various sources that Gridiron has been running the numbers behind the scenes, and will fully audit them to make sure they’re correct.
And you thought quarantine was tough.
I can tell you this: I double-checked every score in every game from the state. I cross-referenced Gridiron with NJ.com and MyCentralJersey.com and MaxPreps. Sometimes I got three different scores.
I did the best I could.
Be that as it may, please note that the numbers I’m presenting here are my final numbers. They are also unofficial, meaning if you see different numbers from the NJSIAA somewhere, those are official, not mine.
In the end, my calculations show Phillipsburg as the “strongest” team in Central Jersey, based on the Strength Index, checking in at 91.41, good for fourth in the state.
The Liners trailed Wall (95.20), St. Joseph-Montvale (93.85), and Holy Spirit of Absecon (93.85).
Somerville – Central Jersey Sports Radio’s “Team of the Year” as the No. 1 team in our final Top Ten – was 9th in the state at 89.95. Though the Strength Index rounds to two decimal points, Somerville was slightly behind Ramapo, which also checked in at 89.95, but was officially at 89.951 while Somerville was an 89.947.
Somerville and Phillipsburg were due to square off at Brooks Field in Week 8 – the second week of the postseason – but a positive case on the Somerville team caused the game to be cancelled, and the Pioneers’ ended up finishing 7-0, while the Stateliners had their game against Easton cancelled due to COVID, and ended up 6-1.
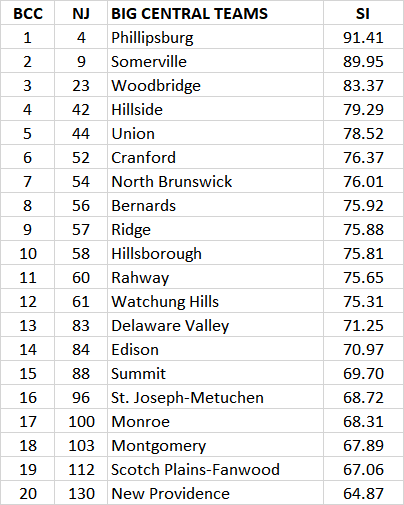
Here are the Top 20 teams in the Big Central Conference, according to Central Jersey Sports Radio’s unofficial, recalculated Strength Index numbers:
Below are the Top 20 teams in New Jersey:

In a typical year, the Strength Index is re-centered in the off-season around a midpoint of 60 by 1/3. That is, a team above 60 is reduced by 1/3 the distance to 60, while a team below 60 is increased by the same amount. A team with an SI of 90 (which is 30 points from 60) would be reduced by 10, making it an 80 to start the following season.
This is necessary to reduce the “historical” impact of one season on another, though some carryover is necessary, since teams are virtually never comprised of entirely new players each year; seniors graduate, but juniors and younger players remain in the program, most coaches are back the following year, etc.
However, the NJSIAA has yet to decide how it will deal with Strength Index for 2021. One of the concerns is that while – in a normal year – most teams would play 10 or more games (regular season plus playoffs/consolations), no one played more than 9 this year, and some managed six or fewer.
Sources tell CJSR that all options appear to be on the table, including a greater re-centering, no re-centering, throwing out all of 2020 (since many teams played opponents they normally wouldn’t have just to fill in open dates on their schedules left by COVID), or any combination of those options.
CLICK HERE for the full, unofficial statewide Strength Index rankings.
CLICK HERE for the Big Central Strength Index rankings.
Strength Index explained…
The NJSIAA’s Strength Index formula is loosely based on the Born Power Index. It’s calculated after every game played.
The difference between Team A’s rating and Team B’s rating produces the expected result, in favor of one team or another.
If the favored team wins by more than the expected result, their Strength Index value goes up by 1/5 of the difference. If they win by less than the expected result – or lose – their Strength Index value goes down by 1/5 of the difference. The other team finds their Strength Index value go up or down by the opposite amount. (If Team A goes up by 3 points, Team B goes down by 3 points.)
However, unlike the Born Power Index, a team’s Strength index is not used to determine their playoff standing, since both system’s increase a team’s rating if it wins by more points – which can actually be an accurate measure of strength).
Instead, the NJSIAA uses the Opponent Strength Index. That averages the Strength Index of a team’s opponents, but gives full values for wins and half value for losses.
Strength Index Example #1:
Team A has a rating of 90. Team B has a rating of 80. The expected results is Team A by 10.
Team A wins by 25 points, which is 15 points more than expected.
Team A’s Strength Index increases by 1/5 of 15, or 3, to 93. Team B drops by 3 to 77.
Strength Index Example #2:
Using the same values, Team B wins by 5 points. They did 5 points better than expected.
Team B’s Strength Index increases by 1/5 of 5, or 1, to 81. Team B drops by 1 to 89.
Discover more from Central Jersey Sports Radio
Subscribe to get the latest posts sent to your email.
It’s a good list other than Bernard’s and other group 2s. U can’t put a group 2 team – dominating other small schools – up against Group 4s and 5s. There is no basis for comparison.
You have no way of knowing how they would fare against the big boys. Maybe they could hang- but would you really be surprised if they were a 500 team like a Hillsborough as an example- who played a real large school schedule? What about St Joes Metuchen- you can’t tell me that most sportswriters wouldn’t pick them at 3-5 with their schedule to beat them. How would these schools do with the same schedule ? Likely 1 loss as well in their division- Watchung Hills beat PBurg- Bernard’s above them- really?
No disrespect- but any group 2 is an N/A on a list like this- no matter how many small schools they dominate. I’d make same case for the Del Val’s- New Prov etc.
It’s not reasonable to put the Smalls in here. Not realistic Apples and oranges. Big time system flaw.
All fair points, but it’s all math, so it’s not *me* putting them there. The SI value is based essentially on how much you score against other teams based on the difference of your rating. If Bernards played a bunch of teams rated 5 points higher and beat them all by a touchdown, they’re gonna climb. Beating teams 30 points lower than them by 40 would have a similar effect. It’s all relative.